Introduction
Many factors are known to determine the applicants’ choices when entering Higher Education. Examples range from the socio-economic background of applicants [1–4] to their gender [5–8], but also include the expected earnings differentials between education fields [9, 10]; self-identification and career opportunities [11, 12]; ability beliefs and heterogeneous tastes [13–15]; political views, and applicants personality [16]. However, little is known on how these factors translate into organizational principles of higher education systems.
Linking individual actions to higher-order organizational principles of human-made systems has been a long lasting problem in computational social sciences [17–22]. Such link plays a crucial role in our ability to design effective governance instruments and interventions. Indeed, the effectiveness of an intervention is arguably bounded by our understanding of how elements in a system can affect each other. In the context of higher education [23, 24], a lack of such knowledge materializes in our inability to answer simple questions, such as, how do changes in the demand of a given degree program spillover throughout the system? Would such variations be observed equally across all degree programs or would we, instead, observe a predictable and structured spillover dynamics? And what should we expect regarding other measurable features?
Here, we propose the Higher Education Space (HES) as a data-driven mapping of the interdependence between degree programs, and thus as an instrument to improve the effectiveness of policy-making in higher education. Similarity between degree programs is measured by proxy from the revealed preferences of applicants when applying to higher education. The emerging structure, the HES, is a network that connects pairs of degree programs according to the likelihood that they co-occur in the applicant’s preferences. Therefore, the HES represents ‘how students, not administrators or faculty, think about the grouping of’ degree programs [25]. This structure contrasts with the state of the art classification, the International Standard Classification of Education (ISCED) [26, 27], based on the similarity of degree programs according to their expected course content.
Our work briefly presents findings that illustrate the relevance of the HES in different topics and in the context of the Portuguese and Chilean higher education systems. Both countries have a similar and centrally run application process to higher education. However, they also contrast in many socio-economic aspects, which help us to highlight possible universalities and contrasts.
The HES reveals the existence of positive autocorrelations [28] among features [59] of degree programs. These features include gender balance, application scores, demand-supply ratio, unemployment level, first-year dropout rate, and mobility. The autocorrelations patterns indicate that features tend to be positively assorted throughout the network structure of the HES, meaning that, if a degree program exhibits a high prevalence of, say, female applicants, then, degree programs up to two/three links away will also show a similar prevalence. Furthermore, while some features (e.g., application scores and demand-supply ratio) also exhibit autocorrelations patterns with respect to temporal variations, others do not (e.g., gender balance).
Results also show that autocorrelations regarding unemployment cannot be explained merely by matching elements with similar features. Indeed, the connectivity structure of a degree program in the HES seemingly plays a determinant role in the reported unemployment levels. In that respect, we observe that connected degree programs tend to have similar unemployment levels, even after controlling for feature-matched, but unconnected, degree programs. Naturally, this finding can have implications for applicants when weighing the potential future gains and costs of choosing a given degree program.
This manuscript is organized as follows: Sect. 2 presents a short description of the data used in this study as well as the cleaning and preprocessing procedures; Sect. 3 presents the results along with a detailed discussion; and Sect. 4 concludes with final remarks and by summing up all contributions of this work and its societal implications.
Data
The data from both countries, Portugal and Chile, consists in a set of ranked preferences listed by applicants to the Portuguese (PHES) and Chilean (CHES) Higher Education Systems. In the PHES applicants’ can list up to six preferences, while in the CHES they can list up to ten. Each preference corresponds to a pair of Institution and Degree Program. Each preference is unique, meaning that a specific pair of institution and degree program cannot appear twice in an applicant preference list. Here, we study the interconnection between Degree Programs, therefore, the same Degree Program (offered by different institutions) can show up more than once in the pre-processed preference list of an applicant.
The PHES dataset includes application records to all public higher education institutions between 2008 and 2015, and it is not publicly available. The Portuguese data was obtained through a research collaboration with the Agency for Assessment and Accreditation of Higher Education, A3ES, [60] and sourced from the Directorate General for Higher Education, DGES.[61] The data is anonymized to make it impossible to identify specific individuals.
The CHES dataset spans from 2004 to 2018, and includes all 36 institutions that belong to the Rectors’ Council of Chilean Universities, CRUCH [62] and it also includes all the private institutions that participate in the Universal Admission System (SUA). The Chilean data was provided by the Department of Evaluation, Measurement and Educational Record, DEMRE, [63] which follows a standardized protocol for data protection. The Chilean datase can be obtained under request on the DEMRE website. [64]
Data preparation
Concerning the PHES, degree programs are identified by a name, an unique 4-digit ID, and each is associated with a 3-digit ISCED code. Degree programs with the same name can have different IDs due to several distinguishable characteristics such as: 3-year (BA) or 5-year (BA + MA) programs; programs taught in different languages (Portuguese or in a foreign language) and programs taught during daytime (normal) or in a post-laboral (special) regimes. In order to clean and disambiguate these situations we have applied the following steps: (1) Discard all degree programs that are not taught in Portuguese; (2) Discard all degree programs that are not taught in the normal regime (daytime); (3) Aggregate degree programs with the same name but different IDs and (4) Discard all degree programs that are not offered in every year under study. After the above steps the list of degree programs was reduced from 1006 to 313.
Concerning the CHES, each pair of degree program and institution is identified by a unique ID. Thus, for instance, all degree programs in Physics will have different identification IDs, one per institution. Besides, information on the ISCED classification is available only at first two levels. To map CHES data to ISCED classification, we disambiguate degree programs manually. We curated the dataset by aggregating all degree programs with similar name, description, curriculum, and ISCED classification. We also discarded the first two years (2004 and 2005) of data since the ISCED classification is not available for those years. Thus, from an initial pool of 1132 degree programs we obtained a list of 212 programs.
Finally, in both higher education systems, CHES and PHES, we have also discarded applicants older than 21 years old, applicants with less than two preferences in their applications (after the pre-processing of the degree programs as detailed above, these are less than 5% in the PHES), and limited our analysis to the first application round. These last two conditions, effectively exclude applicants entering Higher Education System via special pathways. Considering all the filters applied, from the initial applicant pool of 561,752 (PHES) and 3,246,662 (CHES) we were left with 355,173 (PHES) and 691,159 (CHES) individual applications.
Descriptive features of degree programs
We collected descriptive features for each degree program to explore the existence of autocorrelation patterns, which might explain the organization of the Higher Education Space (HES), and to validate the emergent network structure. The features were engineered from the aggregated data of applicants (application scores, gender, degree program demand, and geographical origin) or from institutional reports (unemployment levels, academic supply, and first-year dropout rates).
Each feature is standardized by year and across all degree programs in the HES for each country. For instance, the gender balance of each degree program is estimated by (i) computing the fraction of female enrolled students in each degree program, (ii) standardizing these values by subtracting the average fraction of enrolled female students among all degree programs and (iii) dividing by the standard deviation, thus obtaining a Z-score. Standardization of the features yields not only comparable results across time but also across degree programs of the entire system.
In this work we focus on the analysis of the following features:
- Gender balance (PHES and CHES), computed from the fraction of female applicants enrolled in each degree program at the end of the application process;
- Application scores (PHES and CHES), reported in the dataset. These correspond to the combined marks obtained from the secondary school and the required nationwide exams of access to the Higher Education System. Application priority in each higher education system is given by the application score;
- Demand-supply ratio (PHES and CHES), given by the ratio between the number of applicants that chose a given degree program as their first choice [65] by the number of open positions or academic supply (reported in the dataset) in that same degree program. This normalization ensures that demand is corrected for size effects (i.e., cases in which the sheer size of supply can drive demand). This indicator is similar, in spirit, to the “strength index” [29] sometimes computed to quantify institutions ability to fill the available offer from with the first choices of applicants;
- Geographical mobility (CHES only), estimated as the distance by car, in km, between the candidate’s city of origin and the location of the main campus of the institution of enrollment. This distance was obtained using queries to google maps.;
- Unemployment level (PHES only [66]), compiled and reported by institutions at the level of degree program;
- First year dropout rate (PHES onlyh), given by proxy from the enrollment situation of applicants at the end of the first year.
Results and discussion
The higher education space
The Higher Education Space (HES) relates pairs of degree programs that exhibit a positive and statistically significant co-occurrence relationship in the applicants’ preferences list [30–33]. To that end, we start by estimating the strength of the relationship between two degree programs using the methods of ϕ-correlation and then through two statistical tests we discard links whose statistical significance doesn’t allow us to claim the existence of such relationships either due to small sample size or because the observer correlation can be just due to pure chance.
The ϕ-correlation index between pairs of degree programs, i and j, which we define as 𝜙𝑖𝑗ϕij, can be commputed as:
where 𝑀𝑖𝑗Mij corresponds to the observed number of co-occurrences between degree programs i and j, 𝑀𝑖Mi is the total number of co-occurrences a degree program i participates (𝑀𝑖=∑𝑖𝑀𝑖𝑗Mi=∑iMij), and N is the total number of co-occurrences in the dataset (𝑍=∑𝑖𝑀𝑖/2Z=∑iMi/2). Positive/Negative values of 𝜙𝑖𝑗ϕij indicate that increasing numbers in the prevalence of each degree program are likely to result in an increase/decrease in the number of co-occurrences between them. We discard all negatively correlated relationships, since these edges indicate pairs of degree programs whose co-occurrence pattern cannot be explained by the prevalence of each degree program alone.
Next we filter links by performing two statistical tests. The first tests whether measured ϕ-correlations can be explained by pure chance alone, while the second tests if the identified ϕ values are different from zero given the sample size and the associated standard error.
The first test is performed by comparing the observed 𝜙𝑖𝑗ϕij with a null-distribution obtained from an ensemble of 𝑁=1000N=1000 randomly generated networks. Each random network is generated by shuffling the preferences of the candidates in each year while maintaining constant the number of preferences of each candidate and the number of times each degree program was chosen in a year [34]. For each randomization k we compute the 𝜙̃ 𝑘𝑖𝑗ϕ~ijk associated a pair of degree programs. The ensemble of such values form the null distribution 𝛷̃ 𝑖𝑗={𝜙̃ 1𝑖𝑗,𝜙̃ 2𝑖𝑗,…,𝜙̃ 𝑁𝑖𝑗}Φ~ij={ϕ~ij1,ϕ~ij2,…,ϕ~ijN}. Using statistical inference methods [35] we estimate the p-value associated with 𝜙𝑖𝑗ϕij by calculating the upper tail probability of obtaining a value equal or greater than 𝜙𝑖𝑗ϕij from the cumulative frequency of the null-distribution 𝛷̃ 𝑖𝑗Φ~ij. We discard links with a significance of p-value >0.05.
Secondly, since the magnitude of observations varies across different degree programs we use a t-test to infer whether the positive correlations are significantly distinguishable from zero. To that end, we compute:
where 𝐷−2D−2 represents the degrees of freedom, which we take as 𝐷=max(𝑀𝑖,𝑀𝑗)D=max(Mi,Mj) [30]. We consider only links that are statistically significant with p-value ≤0.05 (𝑡𝑖𝑗=2.06tij=2.06 for 𝐷=25D=25, one tailed).
To sum up, we discard links with negative ϕ-correlation and that fail two statistic significance tests with p-value ≤0.05. The first tests whether the identified ϕ-correlations are not just the result of pure chance, while the second discards links that due to the number of observations do not allow us to claim that the ϕ-correlation are significantly different from zero. Finally, we discard self-connections from the analysis, as we are interested only in relationships between different-degree programs.
Figure 1 shows the HES network structures for Portugal and Chile. Nodes represent degree programs and are colored according to the nine groups of the first level of the ISCED classification: Arts and Humanities (dark blue), Social Sciences (dark green), Sciences (dark purple), Engineering (dark yellow), Agriculture (pink), Education (red), Services (light purple), and Health (light blue). The size of the nodes is proportional to the number of observations.
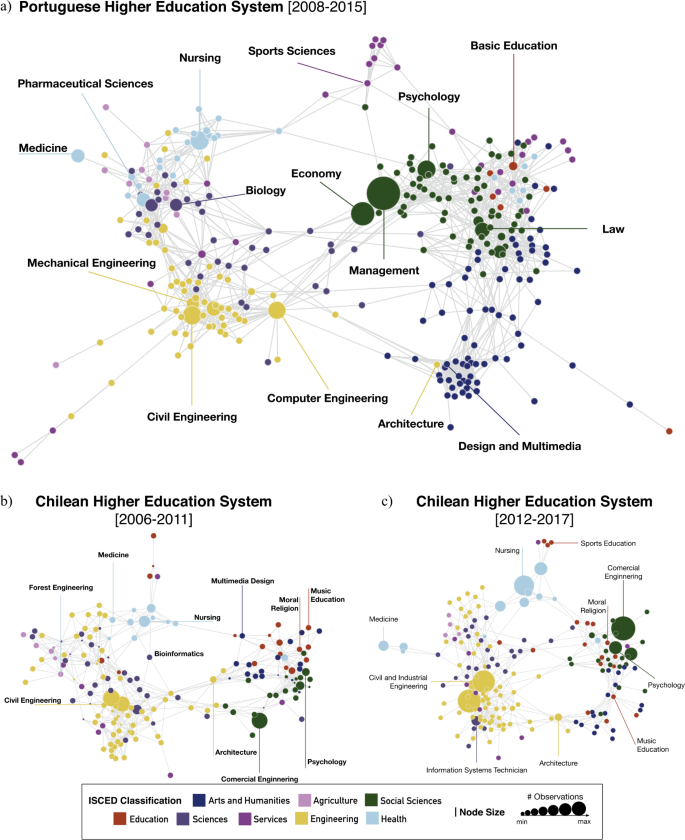
The PHES network (Fig. 1(a)) results from all application preferences between 2008 and 2015, since no major and significant changes occurred in the system during that time interval. By contrast, the CHES network analysis is divided into two periods, due to the 2012’s addition of nine new universities (see Additional file 1). The first period (Fig. 1(b)) considers applications between 2006 and 2011, while the second (Fig. 1(c)) analysis those between 2012 and 2017.
The PHES and CHES networks are sparse (between 2% and 5% of the maximum number of relationships possible) and highly clustered (clustering coefficient measures between 0.46 and 0.49) when compared to random networks with similar density of links. The high clustering coefficient invites the use of network science methods (e.g., modularity-based network partition algorithms) to derive a classification/grouping of degree programs (see Fig. 2 and related discussion bellow). Each network exhibits a diameter between 6 and 11 links, and an average path length (APL) between 3.94 and 4.22. Both CHES networks have fewer nodes than the PHES network (177 and 179 against 312) but relatively similar connectivity per degree program—7.44 and 6.72 against 8.51. There are common elements in all three networks, viz. the existence of three main clusters: one dominated by degree programs in Engineering; a second one that involves degree programs in Biology, Sciences, and Health; and a third with a strong representation of degree programs in Arts and Humanities, and Social Sciences.
Overall, the HES space is characterized by a doughnut-shaped structure with a few degree programs occupying a central region connecting opposite sides of the network. This topology is not new and similar networks were obtained when mapping science and research areas [36, 37]. Nonetheless, the above structures can have relevant implications for higher education policy development. For example, the centric role of Economics and Management (Commercial Engineering in Chile) connecting the Engineering, Arts and Humanities and Social Sciences clusters might hint to potential trans-disciplinary crossings when designing future changes in the system [38–40].
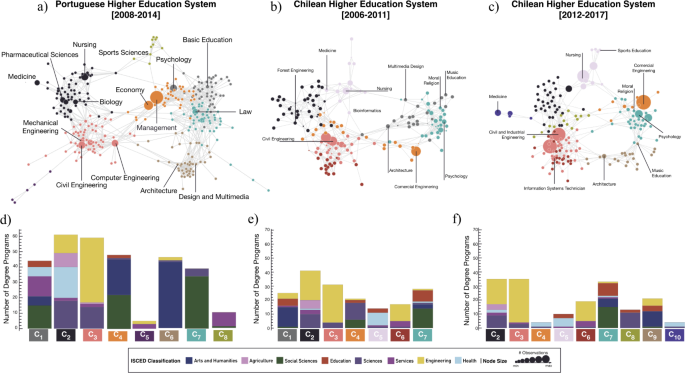
As mentioned above, the high clustering levels in all three networks invite for a classification/grouping of degree programs based on the network structure of the HES. Figure 2 shows the best partitions obtained using the Louvain algorithm [41], where nodes of the PHES (a) and CHES ((b) and (c)) are colored according to the partition they belong. [67] The best PHES partition has a modularity of 0.71 and explains 88% of the intra-group connectivity. When compared with the ISCED classification, these values correspond to an improvement of 42% in modularity and of 27% in intra-group connectivity. Likewise, the best partition of both the CHES networks exhibit a modularity of 0.67 explaining 83% of the intra-group connectivity with an improvement of 67.5% over the ISCED classification, see Fig. 2(d)–(f).
The International Standard Classification of Education (ISCED) [26, 27] was developed in order to facilitate comparative statistics between different countries. It is also commonly used in academic studies and nationwide reports of the state of higher education. The ISCED premise is to group degree programs according to the their course content and does not represent the applicants nor educators perspective. Such premise contrasts with the data-driven and network-based approach derived here, which stems only from applicants perspective.
Figure 2(d)–(f) shows the composition of each HES group according to the ISCED classification of its constituents. Colors among similar groups (𝐶1C1 to 𝐶8C8) of different HES are kept consistent to ease comparison. Groups of similar color match groups located in similar regions of the PHES and CHES. For example, group 1 (𝐶1C1) in the PHES is composed of 14 degree programs from the Science Education Field, 1 degree program from the Agriculture field, 42 degree programs from the Engineering field, and 2 degree programs from the Services field. Communities have been named in order to make their composition comparable across the CHES and PHES networks, when possible. The observed diversity of ISCED scientific fields in each community shows that administrators and policy makers should take care in devising policies based on sectoral analyses developed by scientific fields only. This is specially relevant for policies aimed at solving access inefficiencies of the higher education system. This note of caution will be reinforced by the results found for positive assortment in the HES—see next section below.
As expected, there are differences and similarities among the three HES. Firstly, the number of communities differs between the PHES (8) and the CHES (between 6 and 9) which might be explained by the size of each network and degree program diversity (see Additional file 1 for more details about each system). Secondly, the organization of the CHES network seems to have changed in the second time period, becoming more similar to the PHES network. This conjecture is backed-up by the number of communities and visual inspection requiring future validation, but raises interesting questions: 1) does globalization of higher education [42–45] lead different HES to evolve towards similar structures? and 2) since these structures are based on applicants’ choices, are they adapting quickly to societal transformations and is policy on higher education able to follow suit?
Feature assortment in the higher education space
The Higher Education Space (HES) is estimated uniquely based on the applicants’ choices and completely nescient about particular features that characterize each degree program. Thus, the emergence of three coherent and similar networks, in two different countries and for different time periods, naturally leads to the question of what explains the emergence of these same structures? The answer likely lies in a multiplicity of factors, some of which we briefly explore here by matching the HES network structures with available data on descriptive features of degree programs—e.g. gender balance or unemployment levels (cf. Sect. 2.2). It is important to keep in mind that other factors involved in the applicants’ choices can certainly help to explain the structure of the HES. However, due to data limitations and the scope of this manuscript such exploration is left for future work.
Figure 3(a)–(c) shows the PHES (a) and the CHES (b) and (c) where each degree program is colored according to the gender balance in 2015 (Fig. 3(a)), 2011 (Fig. 3(b)), and 2017 (Fig. 3(c)). Orange (Gray) tones identify an above average representation of female (male) applicants. The distribution of Gender prevalence among degree programs is not random or uniform but, in fact, it is clustered, resulting in the predominance of one gender over the other in particular regions of the HES. Similar patterns are observed for all other features such as application scores, unemployment levels, demand-supply ratio, mobility, and first-year dropout rates (see Additional file 1).
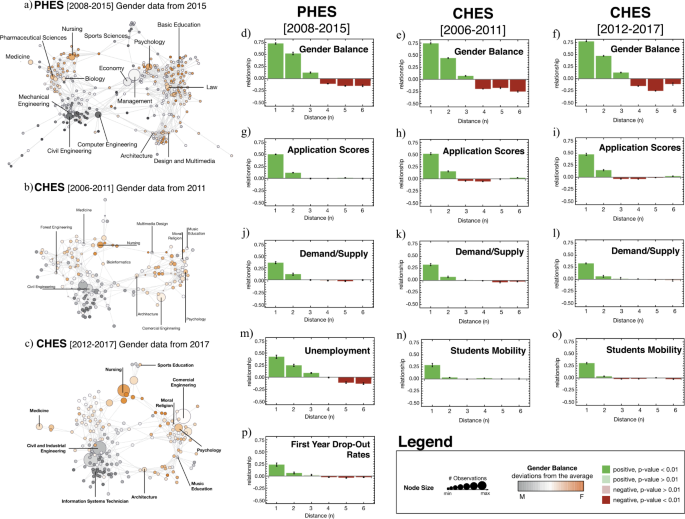
Figure 3(d)–(p) explores, quantitatively, these clustering patterns (i.e., positive assortment) over the HES. To that end, we compute, for each feature, the autocorrelations between pairs of degree programs at different distances in the HES network (i.e., measured by the minimum number n of links that form a path from one degree program to the other). Bars represent the autocorrelation averaged over all observation years, and error bars the standard error in the estimation of the coefficients. For example, an autocorrelation of 0.75 at 𝑛=1n=1 for gender dominance, means that degree programs separated by one link exhibit, in average, 75% of the proportion of Female students of a focal degree program. Positive (negative) autocorrelation coefficients are shown in green (red). Bars in light colors indicate an autocorrelation that is not significantly different from zero (failed a t-test with 𝑝>0.05p>0.05).
These positive/negative relationships between pairs of degree programs seem to ascertain previous findings [3, 4], in that some groups of students tend to choose similar preferences based on similar determinants of choice. For example, a positive assortment in gender balance (Fig. 3(d)–(f)) confirms the existence of different preferences between gender groups, as found in [5–7, 46]. But more importantly, and a non-trivial finding of this approach, is to be able to show How and Where these similarities spread through the network and how neighbouring degree programs (nodes) influence or contaminate each other. In other words, how features spillover throughout the network structure of the HES. Returning to the gender balance example, Fig. 3(d)–(f) confirms what was already noticeable by visual inspection—the more female applicants apply to a degree program, the more female applicants are observed in neighboring degree programs, when compared with the average prevalence of female applicants in the entire system. This relationship is positive, significant up to two links, and holds for both Portugal and Chile. Positive autocorrelations, up to two neighbours, are also found, although not so strong, for application scores (Fig. 3(g)–(i)) and demand-supply ratio (Fig. 3(j)–(l)), in both countries.
Due to data availability, autocorrelation patterns for unemployment levels (Fig. 3(m)) and First Year Drop-Out rates (Fig. 3(p)) are calculated for the PHES only. Both show similar behavioural patterns as in the previous features, although the positive relationship in unemployment levels extends to three-links of distance instead of two. Again, due to data constraints, the Student Mobility feature is only analyzed for the CHES (Fig. 3(n)–(o)). The positive relationship observed in the geographical mobility seemingly vanishes quicker with the network distance, although it remains statistically significant at distance = 2 being zero for larger distances. Two possible explanations for the lack of a positive autocorrelation away from the first neighbors can be: (1) most applicants assign a small weight to distance as a factor in the choice of a degree program, and (2) the majority of applicants has a tendency to apply to degree programs that minimize the distance to their local of origin. Although previous research seems to support the second hypothesis [47–52], a more in-depth future analysis is needed to answer this question conclusively.
In sum, all features exhibit positive autocorrelations that extend up to two/three links of separation. The Higher Education Space captures information embedded in the interplay between degree programs, which is revealed by studying the preference patterns of applicants. These results are a natural outcome of all the information applicants’ carry at the moment of their choices [53] (i.e., either contextual information used in the decision making or inherent characteristics of applicants), which in turn modulates the topology of the HES.
Temporal variations in features
In the previous section, we have shown How and Where certain degree programs are positively correlated, in several features, as a function of the network distance between them. In this section, we examine how temporal changes in these features can spillover throughout the HES. By understanding the When of the autocorrelations patterns, it is possible, for instance, to perceive how external shocks propagate through the system. As an example, we take the particular case of the building sector in Portugal—one of the most affected by the financial crisis that hit the country between 2010 and 2014 (a crisis that was preceded by a downward path since the beginning of the millennium and the global financial crisis of 2008 [54]).
Figure 4(a)–(b) shows, for the PHES, the temporal variation in the demand-supply ratio for Civil Engineering (a) and Architecture (b) between 2008 and 2015. Also shown (light gray) are the temporal variations of their closest direct neighbors in the Higher Education Space network (averaged is highlighted in red). After the economic and financial crisis, the construction industry was one of the most negatively affected [55, 56]. A priori (without knowing the structure of the network), one could expect that both Civil Engineering and Architecture would suffer a similar impact on their demand-supply ratio given their close market relationship. However, a closer inspection of Fig. 4(a)–(b) shows that the negative impact on the demand for Civil Engineering is not observed for Architecture. More importantly, in both cases, the variations are consistent with the average behaviour of the nearest connected degree programs (temporal spillovers). This confirms and reinforces the above finding where both belong to two different clusters (architecture being closest to degree programs in Arts and Humanities than to Engineering), c.f. Fig. 1.
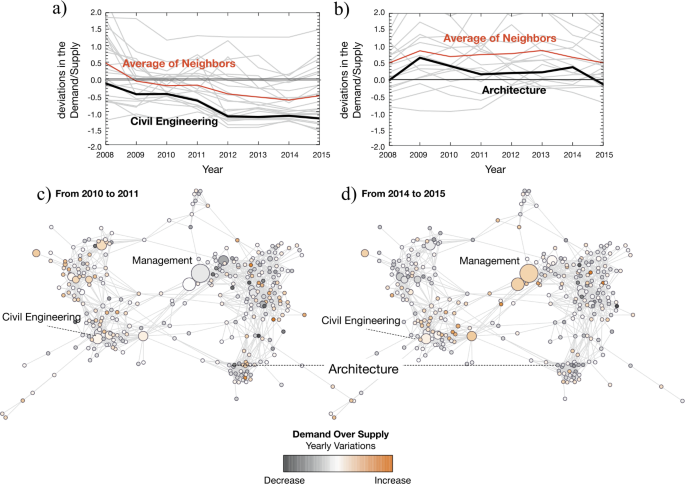
The spatial autocorrelation patterns, concerning the temporal variations of features, help to explain how the observed changes affect entire regions of the network in different ways and in different time periods. For example, a clearly discernible pattern in Fig. 4(c)–(d) reveals that variations in the demand-supply ratio reversed from one part of the network to the other in two distinct time periods (2010/11—Fig. 4(c) and 2014/15—Fig. 4(d)). These temporal spillovers are confirmed by the autocorrelation patterns of the yearly time variations of each feature, over all degree programs in the PHES (Fig. 5(a)–(b)). There are positive effects in time that remain up to two links of separation in the demand-supply ratio and application scores, suggesting that, not only these two features changed over time (thus reacting to conjunctural changes) but also that those changes spillover to their neighbours.
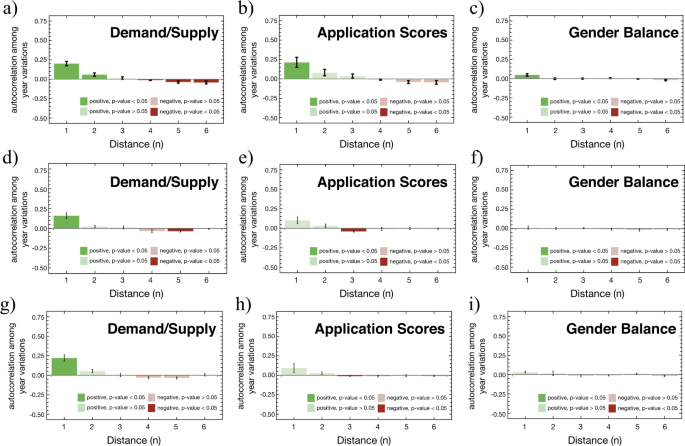
However, we do not find autocorrelation patterns among the temporal variations for all features. Certain features, such as the demand-supply ratio (Fig. 5(a), (d), and (g)) and application scores (Fig. 5(b), (e), and (h)), show a synchronous variation over time, suggesting that it responds to contextual changes. On the other hand, gender balance (Fig. 5(c), (f), and (i)) do not change over time, suggesting that it is likely to respond to more long-term structural changes, e.g., cultural mechanisms, and other socio-economic factors. Moreover, it is important to state that such effects although relevant in magnitude don’t appear to be significant for the application scores in the CHES network (see Fig. 5(e) and (h)).
Measuring unemployment similarity
Thus far, we have identified prevailing autocorrelation patterns of features describing degree programs and applicants in both spatial distribution and temporal variations. But, how informative is the Higher Education Space on the higher education system? For example, can we explain the expected unemployment levels of degree programs just by looking at its connections in the HES?
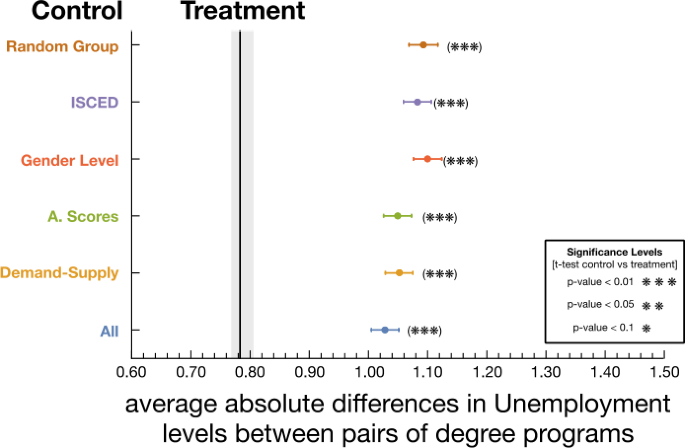
To explore this question we use a propensity score matching identification strategy. We define the treatment as the link between two degree programs in the HES. Thus, degree programs in the treatment group are necessarily connected in HES and the degree programs in the control groups are not connected in HES. Then, we compare the difference in unemployment levels in the treatment group against several control groups. To generate the control groups we match to each pair in the treatment group, a second unconnected pair of degree programs with an equivalent level of similarity in terms of features. Thus, we built five control groups: (1) gender level, (2) application scores, (3) demand-supply levels, (4) a control group with degree programs of the same ISCED field, and (5) all features combined. In addition, we built a randomly sampled control group, where pairs of nodes are taken at random disregarding any similarity.
In Fig. 6, rows show the average of the absolute difference in unemployment levels between pairs of degree programs for each control group. In all cases, the differences are smaller for the treatment group (vertical black line) when compared to the control groups (all differences are statistically significant—t-test between the averages of the two groups with an upper-bound p-value of 0.001). These findings support the hypothesis that the HES represents a similarity mapping between degree programs from an applicants’ perspective, that is not possible to access by estimating similarities using traditional features alone (e.g. gender, application scores or demand-supply). In other words, the network structure of the Higher Education Space captures information that enables us to improve our understanding of the higher education systems.
We should note that nodes in these networks do not incorporate any information about the institutions. These specificities can potentially change the results of the current model, especially in those cases where factors, such as the prestige of higher education institutions, the societal value of degree programs (e.g. medicine), and the relative location of institutions to their recruitment base can greatly impact the applicants’ choices [58] and consequently, the structural organization of the HES.
Conclusions
The ever growing worldwide complexity ensuing from technological, social, cultural, and economic changes demands the design of highly effective governance instruments that can support the management and policy development of higher education systems. To achieve those goals we need novel data-driven approaches [23, 24] that are able to capture the complex interplay between existing elements of the system and report new, comprehensive and reliable information about its functioning.
By leveraging the information carried by the applicants to the higher education systems of Portugal and Chile at the time of their decision-making we have derived wider organizing principles common to both systems. We show that the Higher Education Space (HES) is sparse, highly ordered, modular, and able to capture multi-factorial information about the applicants’ choices. Moreover, the HES reveals the existence of autocorrelation patterns among many features describing degree programs—gender balance, application scores, unemployment, mobility, demand-supply ratios, and retention rates—that stem from the aggregated characteristics of applicants and/or enrolled students. By construct, the methodology is blind to the applicants individual information, and as such, serves as evidence for validating the HES’s utility as a source of non-trivial information about the system. For example, it informs that degree programs that are closer in the HES tend to be more similar in their features. It follows that these similarities among degree programs have a “contagious” effect between their closest neighbours. While spatial and temporal spillovers are identified in features that reflect conjectural changes (application scores and the demand-supply). In features that reflect structural changes, as gender balance, only spatial spillovers are identified.
Moreover, the connectivity structure of the HES offers non trivial insights on certain features of degree programs, such as unemployment levels, than a proximity mapping using other traditional variables. This implies an important take away for applicants: prevalence of unemployment in some regions (i.e., sets of interconnected degree programs) can later manifest as a job mobility cost for graduates.
As previously stressed by Baker [25], perception mismatches between students or applicants and educators or decision-makers need to be taken into consideration when developing new policies. In that sense, here we proposed a data driven characterization of degree programs that can serve as a complement to the ISCED classification. Through our approach degree programs are grouped according to the applicants’ perspectives, not to their curricular content. Hence, the HES stems from a much richer and multi-factorial decision-making process than the ISCED classification, reflecting how actors in society perceive higher education.
This work is a first approach and, thus, exploratory in nature, it aims at showing the potential of the Higher Education Space in supporting policy development and a better understanding of the organizing principles of higher education. Admittedly, much was left for future work, and our work suffered from several limitations that are noteworthy pointing out. Limitations include the number and scope of available features and the exploration of alternative network inference null models, which could capture the particularities of each application process. Building on that, we identify four main areas for future development: (1) exploring the practical and actual application of the HES in designing effective governance actions; (2) exploring the resulting topological features of the HES for a wider spectrum of countries, which can either highlight the universality of the HES or help us understand different cultural contexts and perspectives shape its structure; (3) in countries where application systems are not governed by a central body—such as in the United States and in Brazil—the methodology herein can be replicated by resorting to nationwide surveys that mimic the application process in countries such as Portugal and Chile. These lines of research would extend the current analysis, test the universality of the identified patterns, and its applicability.
Supplementary Material
Below is the link to the electronic supplementary material. Supplementary describes in detail the data pre-processing and the analysis of degree program characteristics (PDF 1.2 MB)
Acknowledgements
CC and FLP acknowledge the financial support from the MIT Media Lab Consortia and the MIT-Masdar Instiute (USA—Reference 0002/MI/MIT/CP/11/07633/GEN/G/) initiative. CC acknowledges the financial support from Centro de Investigación en Complejidad Social. SE and FLP acknowledge the financial support of A3ES (2015–2017). SE acknowledges the financial support of FCT/MCTES through National funds, for project grants SFRH/BPD/1169337/2016 and by multi-annual funding of CICS.NOVA (UID/SOC/04647/2013). The authors are thankful to the Chilean Department of Evaluation, Measurement and Educational Record (DEMRE) for making the Admission Process to Higher Education data available for analysis. The authors are thankful to Carlos Rodriguez-Sickert for logistic support with the Chilean data set, Jorge Jara Ocampo for collecting data and to César A. Hidalgo, Cecilia Monge, Mary Kaltenberg, Aamena Alshamsi, Tarik Roukny, Vítor V. Vasconcelos, Diana Orghian, Alberto Amaral, Madalena Fonseca, Gustavo Castro-Dominguez, the Collective Learning Group at the MIT Media Lab, Laszlo Barabási and the Center for Network Science Research at Northeastern University for the helpful insights and discussions and the three anonymous reviewers for their contributions that greatly improved the clarity and quality of this manuscript. The findings, interpretations, and conclusions expressed by the authors in this work do not necessarily reflect the views of the Higher Education authorities in Portugal and Chile.
Abbreviations
HES, Higher Education Space; CHES, Chilean Higher Education System; PHES, Portuguese Higher Education System; ISCED, International Standard Classification of Education; DGES, Portuguese Directorate General for Higher Education; A3ES, Portuguese Agency for Assessment and Accreditation of Higher Education; DEMRE, Chilean Department of Evaluation, Measurement and Educational Record; CRUCH, Rectors’ Council of Chilean Universities.
Availability of data and materials
The authors do not have the permission to share the raw nor the processed data used in this study. However, these can be made available upon request to the source authorities: DGES (Direção-Geral do Ensino Superior) concerning the Portuguese data, and DEMRE (Departamento de Evaluación, Medición y Registro Educacional) for the Chilean data.
Competing interests
The authors declare no competing interests.
Authors’ contributions
CC, SE, and FLP contributed equally for this manuscript. All authors read and approved the final manuscript.
Publisher’s Note
Springer Nature remains neutral with regard to jurisdictional claims in published maps and institutional affiliations
References
- Archer L, Hutchings M, Ross A (2005) Higher education and social class: issues of exclusion and inclusion. Routledge, London
- Reay D, Davies J, David M, Ball SJ (2001) Choices of degree or degrees of choice? Class, ‘race’ and the higher education choice process. Sociol 35(4):855–874
- Sewell WH, Shah VP (1967) Socioeconomic status, intelligence, and the attainment of higher education. Sociol Educ, 1–23
- Goyette KA, Mullen AL (2006) Who studies the arts and sciences? Social background and the choice and consequences of undergraduate field of study. J High Educ 77(3):497–538
- Barone C (2011) Some things never change: gender segregation in higher education across eight nations and three decades. Sociol Educ 84(2):157–176
- Hendley A, Charles M (2015) Gender segregation in higher education. In: Emerging trends in the social and behavioral sciences: an interdisciplinary, searchable, and linkable resource
- Stoet G, Geary DC (2018) The gender-equality paradox in science, technology, engineering, and mathematics education. Psychol Sci 29(4):581–593
- O’Dea R, Lagisz M, Jennions M, Nakagawa S (2018) Gender differences in individual variation in academic grades fail to fit expected patterns for stem. Nat Commun 9(1):3777
- Boudarbat B (2008) Field of study choice by community college students in Canada. Econ Educ Rev 27(1):79–93
- Centola D, Eguíluz VM, Macy MW (2007) Cascade dynamics of complex propagation. Phys A, Stat Mech Appl 374(1):449–456
- Holmegaard HT, Madsen LM, Ulriksen L (2014) To choose or not to choose science: constructions of desirable identities among young people considering a STEM higher education programme. Int J Sci Educ 36(2):186–215
- Wilkes L, Cowin L, Johnson M (2015) The reasons students choose to undertake a nursing degree. Collegian 22(3):259–265
- van Tuijl C, van der Molen JHW (2016) Study choice and career development in STEM fields: an overview and integration of the research. Int J Technol Des Educ 26(2):159–183
- Wiswall M, Zafar B (2014) Determinants of college major choice: identification using an information experiment. Rev Econ Stud 82(2):791–824
- Trautwein U, Lüdtke O (2007) Epistemological beliefs, school achievement, and college major: a large-scale longitudinal study on the impact of certainty beliefs. Contemp Educ Psychol 32(3):348–366
- Porter SR, Umbach PD (2006) College major choice: an analysis of person–environment fit. Res High Educ 47(4):429–449
- Schelling TC (2006) Micromotives and macrobehavior. Norton, New York
- Conte R, Gilbert N, Bonelli G, Cioffi-Revilla C, Deffuant G, Kertész J, Loreto V, Moat S, Nadal J-P, Sanchez A et al. (2012) Manifesto of computational social science. Eur Phys J Spec Top 214(1):325–346
- Lazer D, Pentland AS, Adamic L, Aral S, Barabási A-L, Brewer D, Christakis N, Contractor N, Fowler J, Gutmann M et al. (2009) Life in the network: the coming age of computational social science. Science 323(5915):721
- Maroulis S, Guimera R, Petry H, Stringer MJ, Gomez LM, Amaral L, Wilensky U (2010) Complex systems view of educational policy research. Science 330(6000):38–39
- Watts DJ (2013) Computational social science: exciting progress and future directions. The Bridge on Frontiers of Engineering 43(4):5–10
- Jacobson MJ (2015) Education as a complex system: implications for educational research and policy. Model Complex Syst Public Policies, 301–316
- Daniel B (2015) Big Data and analytics in higher education: opportunities and challenges. Br J Educ Technol 46(5):904–920
- Baker RS, Inventado PS (2014) Educational data mining and learning analytics. In: Learning analytics. Springer, New York, pp 61–75
- Baker R (2018) Understanding college students’ major choices using social network analysis. Res High Educ 59(2):198–225
- Schneider SL (2013) The international standard classification of education 2011. In: Class and stratification analysis. Emerald Group Publishing Limited, Montreal, pp 365–379
- Schneider SL (2008) The International Standard Classification of Education (ISCED-97): an Evaluation of Content and Criterion Validity for 15 European Countries Montreal. MZES
- Leenders RTA (2002) Modeling social influence through network autocorrelation: constructing the weight matrix. Soc Netw 24(1):21–47
- Portela M, Areal N, Sa C, Alexandre F, Cerejeira J, Carvalho A, Rodrigues A (2008) Evaluating student allocation in the Portuguese public higher education system. J High Educ 56(2):185–203
- Ronen S, Gonçalves B, Hu KZ, Vespignani A, Pinker S, Hidalgo CA (2014) Links that speak: the global language network and its association with global fame. Proc Natl Acad Sci 111(52):5616–5622
- Hidalgo CA, Blumm N, Barabási A-L, Christakis NA (2009) A dynamic network approach for the study of human phenotypes. PLoS Comput Biol 5(4):1000353
- Porter MA (2018) An undergraduate mathematics course on networks. In: Network science in education. Springer, Cham, pp 3–21
- Sayama H (2018) Mapping the curricular structure and contents of network science courses. In: Network science in education. Springer, Cham, pp 101–116
- Guillaume JL, Latapy M (2006) Bipartite graphs as models of complex networks. Phys A, Stat Mech Appl 371(2):795–813
- Gotelli NJ (2000) Null model analysis of species co-occurrence patterns. Ecology 81(9):2606–2621
- Bollen J, Van de Sompel H, Hagberg A, Bettencourt L, Chute R, Rodriguez MA, Balakireva L (2009) Clickstream data yields high-resolution maps of science. PLoS ONE 4(3):4803
- Guevara MR, Hartmann D, Aristarán M, Mendoza M, Hidalgo CA (2016) The research space: using the career paths of scholars to predict the evolution of the research output of individuals, institutions, and nations. Scientometrics 109(3):1695–1709
- Iii FMS, Marshall CC, Furuta R, Brenner DA, Hsieh H-w, Kumar V (1997) Using networked information to create educational guided paths. Int J Educ Telecommun 3(4):383–400
- Shipman F, Marshall C, Furuta R, Brenner D, Hsieh H-w, Kumar V (1996) Creating educational guided paths over the world-wide web. In: Proceedings of Ed-Telecom, vol 96, pp 326–331
- Waugh A (2016) Meta-majors: an essential first step on the path to college completion. Jobs for the Future
- Blondel VD, Guillaume J-L, Lambiotte R, Lefebvre E (2008) Fast unfolding of communities in large networks. J Stat Mech Theory Exp 2008(10):10008
- Hazelkorn E (2015) Rankings and the reshaping of higher education: the battle for world-class excellence. Springer, Berlin
- Machin S, Murphy R (2017) Paying out and crowding out? The globalization of higher education. J Econ Geogr 17(5):1075–1110
- Killick D (2014) Developing the global student: higher education in an era of globalization. Routledge, London
- Yelland R (2011) The globalisation of higher education. OECD Observer 287
- Gabay-Egozi L, Shavit Y, Yaish M (2014) Gender differences in fields of study: the role of significant others and rational choice motivations. Eur Sociol Rev 31(3):284–297
- Sá C, Florax RJ, Rietveld P (2006) Does accessibility to higher education matter? Choice behaviour of high school graduates in the Netherlands. Spatial Econ Anal 1(2):155–174
- Lourenço D, Sá C et al (2018) Spatial competition for students: what does (not) matter? Technical report, Universidade do Porto, Faculdade de Economia do Porto
- Van Bouwel L, Veugelers R (2013) The determinants of student mobility in Europe: the quality dimension. Eur J Higher Educ 3(2):172–190
- Flannery D, Cullinan J (2014) Where they go, what they do and why it matters: the importance of geographic accessibility and social class for decisions relating to higher education institution type, degree level and field of study. Appl Econ 46(24):2952–2965
- Suhonen T (2014) Field-of-study choice in higher education: does distance matter? Spatial Econ Anal 9(4):355–375
- Walsh S, Flannery D, Cullinan J (2015) Geographic accessibility to higher education on the island of Ireland. Ir Educ Stud 34(1):5–23
- Surowiecki J (2005) The wisdom of crowds. Anchor, New York
- Pereira PT, Wemans L (2015) Portugal and the global financial crisis: short-sighted politics, deteriorating public finances and the bailout imperative. The Global Financial Crisis and Its Budget Impacts in OECD Nations: Fiscal Responses and Future Challenges pp 231–254
- Pedroso P (2014) Portugal and the global crisis. The impact of austerity on the economy, the social model and the performance of the state. Friedrich–Ebert–Stiftung, Berlin
- Vansteenkiste I (2017) Did the crisis permanently scar the portuguese labour market? Evidence from a Markov-switching beveridge curve analysis. Technical report, ECB Working Paper
- Pearl J (2003) Causality: models, reasoning, and inference. Econom Theory 19(4):675–685
- Simões C, Soares AM (2010) Applying to higher education: information sources and choice factors. Stud Higher Educ 35(4):371–389
- Features here correspond to students’ aggregated characteristics in a particular degree program.
- From the Portuguese Agência de Avaliação e Acreditação do Ensino Superior.
- From the Portuguese Direção-Geral do Ensino Superior.
- From the Spanish Consejo de Rectores de las Universidades Chilenas.
- From the Spanish Departamento de Evaluación, Medición y Registro Educacional.
- https://ayuda.demre.cl/forminvestigador.dmr.
- The first option is often considered to reveal the strongest preference of an applicant.
- Obtained from http://infocursos.mec.pt.
- To estimate the best partition we have run the Louvain algorithm 103 independent times and selected the partition that resulted in the highest modularity.
This article is governed by :
