Introduction
From the late 1990s to the present day, the business world and financial markets have undergone a series of changes and transformations that have brought about new risks and, in turn, many opportunities. As a result, the company has gone from a static situation with little relationship with the markets, to a situation of continuous change, increased globalization, the need to increase flexibility and a greater dependence on external agents (national and international administrations, financial entities, clients, suppliers, competitors, investors, etc.) [1]; and all this is in aid of seeking an adaptation to the new environment that is still being built today [2,3].
The following are among the most important changes:
- We have moved from a traditional business model (a business model describes the logic of how an organization creates, delivers, and captures value. Alexander Osterwalder & Yves Pigneur (2010). Business Model Generation. John Wiley & Sons, Inc., Hoboken, New Jersey), to an innovative business model [4], where technology has generated plenty of opportunities. Among the most disruptive technologies we can highlight: artificial intelligence, Internet of Things, digital manufacturing, robotics, the blockchain, unmanned air vehicles and virtual and augmented reality, among others.
The technologies mentioned above have given way to new business models that are changing the economy, our expectations and our behavior [5]. This process responds to a clear dynamic, to a structure that has taken place along all the technological waves and that follows a process that begins with: (1) a breakthrough in science, (2) that materializes in a new technology, (3) reaches the business world and (4) changes the economic and/or social organization.
There is a great variety of disruptive models of business arising, but, due to their relevance and impact, we are going to summarize them in four blocks: those derived from the digital company’s transformation, the economy of platforms, the decentralized model and the pop-up economy and super fluid markets. - We have gone from being dependent on a national market to an international market.
- We have passed from an enterprise where the source of value (economic value) was in the tangible assets to an enterprise, where the intangible assets have taken on a great importance.
That is why the assets such as patents, licenses, trademarks, databases, applications and any other intangible become the main source of value for any enterprise. This intangible or asset offers a range of opportunities and resources that allow the company to access both the current market and others that are continuously opened.
Nonetheless, this world of opportunities is not exempt of risks (risk is synonymous with change, uncertainty. Risk can be the possibility of losing and the possibility of winning. The risk must be seen from a positive point of view, without risk there are no opportunities, what we must learn is to manage that risk), many of them derived from the technological development that favors the capacity of some to take possession of the alien thing or, merely, to do damage by means of the proliferation of a computer virus in the network.
In this technological context, all assets related to information, information storage and intangible aspects of the enterprise and markets, which involves an increasing valuable recognition [6,7].
Thus, we can verify the value of the intangible in the enterprise is rising increasingly against the value of the tangible asset. This should also lead the enterprise to admit this situation in its financial statements, although the growth in the value of the intangible does not evolve to the same extent as the recognition of this intangible by the enterprise in its financial statements.
In this process of recognition of intangible in the financial statements by the enterprise, we have detected a series of situations:
- The National Classification of Economic Activities (by its initials in Spanish, CNAE) activity codes do not correspond to the current reality of the enterprise, especially the multidisciplinary enterprises arisen from the New Economy that are not well recognized in these codes—for instance, Spanish biotechnology companies have been identified with more than 30 different codes—therefore, we think that an update of them is necessary, as well as a greater importance given to the election of the same by the enterprise.
- Many companies that base their activity on the intangible do not recognize it in their financial statements. This recognition has advantages and disadvantages.
Advantages of recognizing the intangible in the financial statements:
- The balance sheet represents the company’s image to a greater extent;
- Increases the value of own funds;
- Increases ability to secure financing;
- More resources for entrepreneurship;
- Better image in the eyes of external agents, such as investors and financial institutions.
The drawbacks of recognizing intangible in financial statements:
- The profit increases for what more taxes will have to be paid. If the company makes losses, this does not have a negative effect, quite the opposite, because its own resources would be reduced to a lesser extent;
- If we abuse the recognition of intangible, we can alter the value of the company and excessively overestimate its value, with the risk of creating a bubble.
In general, the positive effects are much greater than the negative ones, especially in the long term [8,9]. Moreover, many of the drawbacks are not overly negative: if the manager leads a proper direction of the company and does not abuse certain accounting situations; these drawbacks are mitigated. On the other hand, in a world such as the current one, where globalization and the use of new technologies are increasingly present, companies are more and more dependent on external agents. Thus, they must try to make their financial statements represent their true image, otherwise they could cause many problems or the loss of opportunities, such as: fewer facilities to obtain financing through investors, public administrations, financial institutions, less ability to get good clients, less ability to negotiate charges and payments, etc.
Finally, it must be emphasized that entrepreneurship is a world full of risks and opportunities, that the risk should not be seen as a negative, but a positive, that without risk there are no opportunities, that what we need to know is to manage that risk, while maximizing opportunities and minimizing the negative “risks”. There are many ways to achieve this: forming a good team in order to realize our idea (multidisciplinary, dynamic), keep continuous training and be up to date with all new innovations, initiatives, diversifying activities, investments, and knowing how to exploit and manage the company’s intangibles (know-how, patents, products, brands). We will focus on this last point, the management of intangibles.
This article aims to identify the importance for the company of recognizing its intangible in its financial statements, in order to make a good image, be more transparent and improve sustainability [10,11,12,13,14]. In recent years, the importance of recognizing intangible assets has increased, as recognized by the previous work developed by KPMG [15] in Spain, where it was shown that the most important companies consider intangible assets as a fundamental element of sustainability, and crucial for their future investment processes (“it says that intangible assets are growing”). In this sense, sustainability, by definition, refers to meeting the needs of the present, without compromising the ability of future generations to meet theirs, ensuring a balance between economic growth, environmental care and social welfare. This is embodied in the integration of environmental, social and governance criteria into business strategies, known as Environmental, Social and Governance (ESG), and can be quantified through the company’s intangible assets. Companies and investors increasingly take this situation into account when making decisions, because it affects competitive position and long-term financial performance.
According to Daniel Wild (head of Sustainability Investment Research & Development and member of RobecoSAM’s Executive Committee, in the KPMG report [15]), “sustainability investment is the fastest growing segment in finance”. As more and more asset owners are integrating ESG considerations into their investment strategies, sustainability is gradually moving from being a niche investment concept to becoming a mainstream investment solution of the future.
However, for Wild, “while financial materiality is important for both companies and investors, these parties do not always agree on what is really relevant from an ESG perspective”. Companies can help manage this disagreement by demonstrating the financial materiality of specific ESG factors in their reports to shareholders. This, in turn, will encourage investors to integrate ESG factors and sustainability into their investment decision-making process.
On the other hand, research addressing organizational performance and how to achieve sustainable enterprise excellence, has received considerable attention from researchers [16].
Thus, a literature review will be presented. A variance analysis was carried out to see if there is a relationship between the investment in intangible assets and the activity sector and/or region to which the company belongs. It should be noted that, although most start-ups [17], especially in their first years of life, depend on their intangible assets—brands, technological platforms, patents—only a small part of them recognize their intangible assets on their balance sheet [18], this may lead to the loss of opportunities in the medium term. Most of the articles that study intangibles in different activity sectors refer to publicly listed companies. This article refers to intangibles in start-ups, specifically to the relationship between the incorporation of intangibles and activity sectors in 6000 start-ups. The novelty of this work focuses on the incorporation of the intangibles in start-ups (young companies), and the number of 6000 companies studied in this paper, distributed in four regions.
Literature Review
Limitations in traditional financial accounting provide useful information on the external value of companies, and show the gap between the book value and the market value of companies listed on stock exchanges. This gap or mismatch, initially documented by Lev (2001) [19], also shows the existence of other sources of information, representative of value creation, which are taken into account by investors, and which impact on the market value of the companies which are directly linked to intangibles and, especially, to intellectual capital that is not reflected in traditional financial statements [20,21,22].
Other authors [23,24,25,26,27,28,29,30,31,32,33,34,35,36,37,38] have studied the relevance of intangible assets in different markets, such as the USA, Australia, Spain, Portugal, Canada, Argentina, France, UK, Brazil and the Philippines. To this end, they have studied the price and profitability of shares, stock market capitalization, and share prices.
Similarly, the relevance of the value of intellectual capital [39], measured through the share price, by the difference between the share price and the book value of the company, the added value, market capitalization and the market value/book value ratio and Tobin’s Q ratio, has been studied in different markets (South Africa, USA, China New Zealand, Taiwan, Brazil, Italy, UK, Turkey, Tunisia, Indonesia, Philippines, Singapore and Thailand, Kuwait, India, Argentina and information technology companies) [37,40,41,42,43,44,45,46,47,48,49,50,51,52,53,54,55,56,57,58].
Intangibles include a wide range of items that can be classified into two main categories: intangible assets and intellectual capital. The IASB’s definition, set out in its International Accounting Standard (IAS) 383, states that “an intangible asset is an identifiable non-monetary asset without physical substance”.
The term “intellectual capital” represents a much broader concept for which a generally accepted definition has not yet been reached. However, based on the main characteristics present in most of the developed concepts, it can be said that intellectual capital refers to the set of interrelated intangible elements, among which the available knowledge stands out, both individually and as an organization. These elements are somewhat hidden, since they cannot be found in the financial statements prepared based on current regulations, and they allow the company to operate, in combination with the other resources inherent to it, as a source of competitive advantage and value creation [1].
On the other hand, some research shows the existence of a significant and positive relationship between the global figure corresponding to intangible assets, reported through the financial statements, and the market value of companies, as reflected in the studies carried out by Choi, Kwon and Lobo [23], Iñiguez and López [25] and Priotto, Quadro, Veteri and Werbin [30]. Along the same lines, but also working with complementary information to the financial statements, Pacheco, Rover and Rodrigues [37] obtained evidence that the level of disclosure of intangible assets, measured through an index that collects financial information and its explanatory notes, has an influence on the valuation made by the market.
However, regarding different categories of intangible assets, the evidence is solid when it comes to the valuation relevance of identifiable intangible assets, but is not entirely conclusive when it comes to the goodwill. Thus, Godfrey and Koh [24], Ritter and Wells [26], Dahmash, Durand and Watson [28], Oliveira, Rodrigues and Craig [29], Kimouche and Rouabhi [33] and Da Silva, Rodrigues and [34] confirm the evaluative relevance of the two categories. However, Ficco, Werbin, Díaz and Prieto [36], obtain findings that show that identifiable intangible assets have a positive relationship with market prices.
The process by which the preparation of financial statements in accordance with the IASB’s International Financial Reporting Standards (IFRS) has been made mandatory for listed companies, has given rise to a series of empirical studies focused on analyzing the impact of the adoption of the IFRS on the valuation of intangible assets.
Most of these studies have revealed an increase in the importance of intangible assets based on the adoption of IFRSs [27,38], due to the measurement criteria established by IFRSs, by replacing the systematic depreciation of this asset with periodic impairment testing, and, therefore, allowing more relevant and useful information to be produced for investors.
In the case of identifiable intangible assets, the evidence provides mixed results. Thus, the work of Chalmers [27], Ji and Lu [32] and Ficco and Sader [38] shows that these assets have lost relevance for the market when they are accounted for under the international regulatory framework, which is interpreted in relation to the greater restrictions imposed by IFRSs, and the recognition of this type of asset in relation to local accounting regulations, which results in financial statements with a lower information content. Finally, a summary table of the bibliographical review is provided (Table 1).

Methodology and Analysis
This section identifies the companies created since 2012 that incorporate intangibles in their balance sheets in Spain and Andalusia, since it is within an intangible asset where the intangible of each business is located. To develop this epigraph, the SABI (a database marketed by the company Informa, SA and which registers the financial statements of most of the companies that make up the Spanish business fabric) database has been used.
A company can incorporate intangible or know-how in different ways:
- One of the partners can incorporate its intangible through social capital, so it can serve to create a company with a higher level of assets and own resources;
- The company may acquire the intangible through third parties;
- The company can generate its own intangible.
In the first two situations, intangible should be incorporated at market or sales value, and in the latter case, it should be recorded at production cost. In start-ups, the advantages of recognizing this intangible can be greater than in other group of companies, increasing their image, own resources and capacity.
Methodology
The selection criteria for choosing the companies to work with are as follows:
- Companies created since January 2012. The life of a start-up is two years, the last official data of a company refers to 2018. The average life of the population is 4 years as of 2020; as of 2018, therefore, it is 2 years. Thus, the data has been taken since 2012, so that a company has the average life of 2 years, which is actually a start-up.
- Companies registered in Andalusia, Madrid, Catalonia and Valencia (regions in which the intangible is most important)
- Companies created by other companies or groups of companies are not taken into account.
- Active companies with sufficient information.
- Maximum number of employees: 9.
- Companies with intangible assets accounted for in at least one of the last five years.
In order to identify the importance of the region and sector factors on intangible investment, a series of ratios that reflect the same should be defined. In financial theory, there are different indicators that define the level of investment in intangible assets of a company. After analyzing the latest work on the investment and valuation of intangibles and, fundamentally, starting from the type of available information, we decided to choose the existing relationship between intangible assets and non-current assets, as a representative indicator of the company’s level of investment in intangible assets.
The methodology to use will be as follows: for each of the analyzed variables, a prior analysis of the data will be started, in order to try to find a certain uniformity in the behavior of the companies in the sample. In this way, a descriptive study will be carried out that will allow a first evaluation of the existence of differences in intangible investment by regions and sectors.
In a second phase, and in order to test whether there are significant differences in the behavior of the analyzed variables, according to the two considered characteristics of the companies—region and sector—we will use the statistical technique of analysis of variance (ANOVA), one for the sector factor and another for the region factor. The application of this statistical test requires the performance of the appropriate tests to know if the hypotheses necessary to implement it are met: normal distribution of the variable in the different subgroups determined by each factor and homogeneity of the variances. Once the analysis of variance has been completed and, on the assumption that the incidence of sector and regional factors on investment in intangible assets is compared, this statistical test should be completed with the multiple comparisons test, in order to identify which group is different, and with respect to which of the remaining groups show significant differences.
Descriptive Analysis
A total of 117,136 companies have been created in Spain since 2012, which remain active and have sufficient information. Only 22,404 of them include intangible assets in their balance sheet, which is 18.8% of total number of companies [59]. When analyzing start-ups, we find companies created by other companies or holding companies, so that they are made with a volume of sales and economic structure that does not correspond to those of a “normal” start-up; therefore, from the mentioned number of companies, the ones created from other companies will be eliminated, considering criterion “c”. This means that the number of companies created in recent years goes from 117,000 companies to 50,000 companies at the national level; and those that include immaterial assets in their balance go from 22,000 to 10,000 companies at the national level, with 2000 of them being from Andalusia. When it comes to regions, the most important are Madrid, Catalonia, Andalusia and Valencia, with nearly 6000 companies.
The distribution by activity sectors in Madrid, Catalonia, Andalusia and Valencia can be seen in the following Table 2.

In this case, it can be seen how the distribution of activities that incorporate more intangible in their balance differs between the different regions and, in case of Andalusia, differences in the tourism, construction, services and trade sectors can be observed.
In the following lines, we will analyze investment in intangible assets, both in absolute and relative terms.
In the first place, it can be seen that the start-ups that incorporate the most the know-how technique in their balance are in Andalusia, Madrid, Catalonia and Valencia.
In Spain, the recognition of intangible assets of companies with an average life of 4 years stands at EUR 45,000 (average) and EUR 3,000 (median). In the case of Andalusia, for an average life of 4 years, the recognition of the intangible is at EUR 33,000 and EUR 2000 for average and median, respectively. We can see that, on the average level, intangibles are more recognized in Spain than in Andalusia. Among the sectors, we highlight that, in the case of agriculture, construction, services and commerce, most intangibles are recognized in Madrid. When it comes to industry and tourism, Catalonia precedes the list, while Andalusia stands below the Spanish average in all sectors except from agriculture (Figure 1 and Figure 2).


Moreover, if we analyze the relative weight of intangible assets over non-current assets, we will see if the importance of intangible assets over the company’s investments coincides or not with the investment in absolute terms.
In this case, we see how the distribution by activity sectors is different in relative and absolute terms. Thus, in relative investment, the most important sector is tourism; however, in absolute investment, the trade, service and industry sectors are above tourism (Figure 3 and Figure 4).


On the other hand, if we analyze the intangibles according to the sector and regional factors, we obtain the following in Table 3 and Table 4.


The largest investments in intangible assets are in Madrid and Catalonia, and, according to sector factor, services and tourism stand out. In terms of investment by sectors and regions, there is a greater dispersion in the region than in the sector factor.
Finally, after the analysis carried out so far, we can say that there is no clear relationship between the variable investment in intangible assets and the activity sector and regional factor; therefore, it is necessary to carry out an analysis of variance, where it could be seen whether this relationship exists or not.
Analysis of Intangible Variance by Region and Activity Sector
Following our line of work, and after carrying out the descriptive analysis—which does not clearly confirm the existence of differences between the investment in intangible assets of start-ups according to the sector and the region they belong to—we must contrast the results with more rigorous statistical techniques.
Our objective is to establish whether there are differences in the behavior of the analyzed variables, according to two factors of the considered companies: sector and region, or what behavior is the same if these factors (sector and region) have a significant impact on investment in intangible assets [59,60,61]. In this way, the statistical tests should be oriented towards the contrast of the differences observed in the measures of central and medium position, and of the chosen indicator or indicators, which is achieved with the analysis of variance of a factor. Therefore, we will try to carry out two ANOVA tests, one for the region factor and another for the sector factor, and as a dependent variable, we will take the indicative of the investment in intangible assets (investment in intangible assets/non-current assets). Specifically, the hypotheses we want to test are:
In relation to the region:
Hypotheses H1 (H1). There are no differences in the investment in intangible assets of the companies according to the region to which they belong.
Hypotheses H2 (H2). There are differences in the investment in intangible assets of the companies according to the region to which they belong.
In relation to the sector:
Hypotheses H3 (H3). There are no differences in the financial structure of the companies according to the sector to which they belong.
Hypotheses H4 (H4). There are differences in the financial structure of companies according to the sector to which they belong.
Before starting the study, we must carry out the appropriate tests to find out if the necessary conditions are met, in order to carry out the contrast of our hypotheses using the statistical technique ANOVA. Parametric contrasts, such as ANOVA, require normal distribution of the dependent variable and homogeneity of variances, elements that are not necessary in non-parametric contrasts. The result achieved in the latter is, therefore, less robust.
Normality of the dependent variables. In our sample, the hypothesis of normality according to the Kolmogorov-Smirnov test is not accepted, since its level of significance is less than 5%. However, according to the central limit theorem, even in the absence of normality, parametric contrasts continue to show robustness when the sample size is large enough, as is the case here, since we work with all the companies in the population that meet the defined requirements to configure our study sample (Table 5).

Homoscedasticity. In order to contrast the equality of variances of the dependent variable in the different subgroups defined by each factor, the Levene statistic is applied. The values of this test allow us to affirm that in both the region and sector factors, this condition is not fulfilled (Table 6, Table 7 and Table 8), since its level of significance is below 5%.


After testing whether the necessary that conditions for the application of variance analysis are met, we observed that the application of this technique implies problems for the sector and region factors, so we could not directly apply the ANOVA.
However, due to the size of the used sample and the difference of companies between region groups and sectors, we can use robust tests, for example, the Brown-Forshyte test for the region and sector factor, respectively (Table 9 and Table 10).


We then apply multiple comparisons and, specifically, the Games-Howell test, which is used when we do not assume equality of variances.
In this way, this test tells us that in some conditions of the dependent variable investment in intangible assets between non-current assets, the null hypothesis is rejected, so that the region factor and the sector factor influence the level of investment in intangible assets of the companies. For the intangible investment variable between non-current assets, the null hypothesis is rejected; for an alpha of less than 5%, the null hypothesis would be accepted, while for a higher one, the null hypothesis would be rejected. We opt for a 95% confidence level, so, in some cases, we will not accept the null hypothesis for this variable.
Next, and bearing in mind that investment in intangible assets by companies differs according to region and sector, we are going to contrast the influence of the factor between the different groups of companies, because this objective is not achieved with ANOVA.
In other words, we must carry out an analysis to distinguish between which groups of companies these differences are significant, or, in other words, which groups are homogeneous. To do this, we will perform the multiple comparisons test, also called the post hoc test. We will apply the Games-Howell method, because the homogeneity of the variances was not met.
Then, in order to identify in which groups these differences are significant, that is, which groups are homogeneous, the multiple comparison test, also called the post hoc test, is performed. In this way, the Games-Howell method is applied (Table 11).
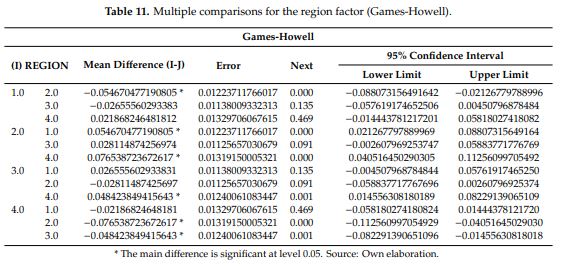
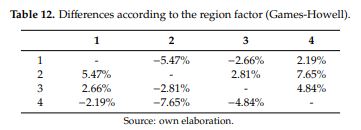
When it comes to the region factor, the results of these multiple comparisons allow us to say that Andalusian companies act significantly differently from those in the region of Madrid (a lower investment of 5.47%), showing no difference with the rest of the regions. In the case of the region of Madrid, there were differences with Andalusia (5.47% higher investment) and Valencia (7.65% higher investment). Catalonia only differs from Valencia (with a volume of investment almost 5% higher). Valencia only differs from Catalonia and Madrid. The regions with a greater recognition of intangibles are Madrid and Catalonia, in that order (Table 12).
On the other hand, when the comparison is made, taking into account the different groups of companies defined according to their activity sector, we can affirm that some sectors present significant differences, such as agriculture, tourism, services and commerce, and others offer homogeneous groups, such as agriculture, industry and construction.
In this case, the differences are more significant than in the regions. In summary, we can say that the agricultural sector differs from tourism, services and commerce, with a difference of investment in intangibles of almost −22%; the industrial sector differs from tourism, services and commerce with an investment in intangibles of −15%; the tourism sector is the one that, in relative terms, invests the most in intangibles, and differs from all sectors except services; the construction sector differs from tourism and services with an investment in intangibles of −14%; the services sector differs from all sectors except tourism; and the commerce sector differs from all sectors except construction.
To check whether this influence exists, the Games-Howell method has been applied, which is used when the homogeneity of variances is not met. Thus, with this method, we can say that in start-ups investment in intangible assets (in relative terms) differs both in regions and activity sectors, but the greatest differences are seen in the activity sectors. The most important sector is tourism, with intangible investments 21.4%, 14.8%, 13.3% and 9.6% higher than agriculture, industry, construction and commerce, respectively (Table 13 and Table 14).


Conclusions
In general, it can be concluded that, despite a period of transformation of business models, the importance of innovation, knowledge and technology is increasing. Although this change does not translate into recognition of it in corporate financial statements, and only 18% of created companies take it into account. This recognition would be a key factor in increasing opportunities and improving sustainability in periods of crisis for the company, in an increasingly volatile ecosystem. Intangible resources are recognized as the most important in achieving business objectives [59,60]. However, a significant part of these resources is hidden and cannot be identified in the financial statements of companies (Lev, 2003 [15]), due to the restrictive requirements of accounting regulations regarding their identification, measurement and valuation.
In particular, we can highlight:
The distribution of activities, by number of companies, that incorporate more intangibles in their balance sheet differs between the different regions, and there are substantial differences in the tourism, construction, services and trade sectors [61,62]
In absolute terms, the recognition of intangible assets of companies with an average life of 4 years stands at EUR 45,000 (average) and EUR 3000 (median). In the case of Andalusia, for an average life of 4 years, the recognition of intangible is at EUR 33,000 and EUR 2000, average and median, respectively. We can see that, on the average level, intangibles are more recognized in Spain than in Andalusia. Among the sectors, we highlight that, in the case of agriculture, construction, services and commerce, most intangibles are recognized in Madrid. When it comes to industry and tourism, Catalonia precedes the list, while Andalusia stands below the Spanish average in all sectors, except from agriculture.
In relative terms, it can be seen how the distribution by activity sector is different compared to absolute terms. Thus, in relative investment, the most important sector is tourism; however, in absolute investment, the commerce, service and industry sectors are above tourism.
From a descriptive point of view, it can be seen that the largest investments in intangible assets, in relative terms and according to the region and activity sector factors, are in Madrid and Catalonia, and that, among all sectors, services and tourism stand out. Regarding investment by sectors and regions, there is a greater dispersion in the region factor compared to the sector factor. However, we cannot state that the region and activity sector factors influence investment in intangible assets.
Finally, it can be concluded that applying the Games-Howell method, the incorporation of intangible assets in Spanish start-ups differs both in regions and activity sectors, although the greatest differences are seen in activity sectors. The most important sector is tourism, with investments in intangibles being 21.4%, 14.8%, 13.3% and 9.6% higher than in agriculture, industry, construction and commerce, respectively. This incorporation and recognition of intangible assets in the tourism business can be a key factor for its sustainability, especially in current crisis situations.
This corresponds to the incorporation of 423 intangible assets in Spanish start-ups, which differ both in regions and activity sectors, although the greatest differences are seen in activity sectors. This is in line with previous research, which posits that the activity sector of the start-ups could influence research outcomes regarding business sustainability, as shown by Fonseca and Domingues in the context of environmental management system transition [63].
As far as future work is concerned, it should be noted that we are currently working with the economic and financial data of more than 6000 start-ups (Andalusia, Madrid, Catalonia and Valencia). Based on this information, it will be possible to develop sectorial balance sheets and income accounts through the distribution functions of the different variables, and see their potential by applying the real options methodology with a Monte Carlo Simulation.
Author Contributions
These authors contributed equally to this work. All authors have read and agreed to the published version of the manuscript.
Funding
This research received no external funding.
Acknowledgments
The authors appreciate the support provided by colleagues from the University of California Berkeley through a collaboration agreement signed by the University of Seville with the Sutardja Center for Entrepreneurship and Technology (SCET) (1 July 2019).
Conflicts of Interest
The authors declare no conflicts of interest.
References
- Bayraktaroglu, A.; Calisir, F.; Baskak, M. Intellectual capital and firm performance: An extended VAIC model. J. Intellect. Cap. 2019, 20, 406–425. [Google Scholar] [CrossRef]
- Madrid-Guijarro, A.; Garcia, D.; Van Auken, H. Barriers manufacturing SMEs. J. Small Bus. Manag. 2009, 47, 465–488. [Google Scholar] [CrossRef]
- Ortiz-Villajosa, J.M.; Sotoca, S. Innovation and business survival: A long-term approach. Res. Policy 2018, 47, 1418–1436. [Google Scholar] [CrossRef]
- Sousa-Zomer, T.; Cauchick-Miguel, P. Exploring business model innovation for sustainability: An investigation of two product-service systems. Total Qual. Manag. Bus. Excell. 2019, 30, 594–612. [Google Scholar] [CrossRef]
- Fundación Innovación Bankinter. Modelos de Negocios Disruptivos. Fundación Bankinter. 2018. Available online: https://www.fundacionbankinter.org/documents/20183/156075/Modelos+de+negocio+disruptivos_Resumen/ (accessed on 15 March 2020).
- McInerney, C.R.; Koenig, M.E. Knowledge management (KM) processes in organizations: Theoretical foundations and practice. Synth. Lect. Inf. Concepts Retr. Serv. 2011, 3, 1–96. [Google Scholar] [CrossRef]
- Russell, M. Management incentives to recognise intangible assets. Account. Financ. 2017, 57, 211–234. [Google Scholar] [CrossRef]
- Bloom, R.; Cenker, W.J. Recognize Tax and Financial Accounting Differences for Intangibles; Practical Tax Strategies; Thomson Reuters: Boston, MA, USA, 2009; Volume 82, pp. 207–211. [Google Scholar]
- Nogueira, M.; Fernández-López, S.; Calvo, N.; Rodeiro-Pazos, D. Firm characteristics, financial variables and types of innovation: Influence in Spanish firms’ survival. Int. J. Entrep. Innov. Manag. 2018, 22, 57–79. [Google Scholar] [CrossRef]
- Perrini, F.; Vurro, C. Corporate Sustainability, Intangible Assets Accumulation and Competitive Advantage. Emerg. Issues Manag. 2010. [Google Scholar] [CrossRef]
- Reis, D.A.; De Moura, F.R.; De Aragão Gomes, I.M. Aspirations and intellectual property in the worldwide entrepreneurship ecosystem. In Proceedings of the European Conference on Intellectual Capital, Pescara, Italy, 23–24 May 2019; pp. 370–380. [Google Scholar]
- Fernandes, C.I.I.; Veiga, P.M.; Peris-Ortiz, M.; Rueda-Armengot, C. What impact does innovation and sustainable entrepreneurship have on competitiveness? Int. J. Soc. Ecol. Sustain. Dev. 2017, 8, 56–66. [Google Scholar] [CrossRef]
- Pant, V.; Yu, E.; Tai, A. Towards Reasoning about Pivoting in Startups with i-Star, CEUR Workshop Proceedings. 2017. Available online: http://ceur-ws.org/Vol-1829/iStar17_paper_4.pdf (accessed on 15 May 2020).
- Shan, S.; Jia, Y.; Zheng, X.; Xu, X. Assessing relationship and contribution of China’s technological entrepreneurship to socio-economic development. Technol. Forecast. Soc. Chang. 2018, 135, 83–90. [Google Scholar] [CrossRef]
- Pueyo, R.; de Gobierno, S. Riesgo y Cumplimiento de KPMG en España, en uno de sus Informes, en él que (24 mayo, 2016. KPMG Tendencias). Available online: https://www.tendencias.kpmg.es/author/rpueyo/ (accessed on 15 March 2020).
- Hussain, T.; Edgeman, R.; Eskildsen, J.; Shoukry, A.M.; Gani, S. Sustainable Enterprise Excellence: Attribute-Based Assessment Protocol. Sustainability 2010, 10, 4097. [Google Scholar] [CrossRef]
- Liu, T.; Qu, S.; Scherpereel, C.M. The Influence of the Role Positioning of Investment Institutions on the Value of Start-Up Enterprises from the Perspective of Network. Sustainability 2020, 12, 491. [Google Scholar] [CrossRef]
- Teixeira da Silva, S.; Abranches Pereira de Carvalho Morais, A.; Curto, J. Disclosure of R&D activities. Glob. Bus. Perspect. 2013. [Google Scholar] [CrossRef]
- Lev, B. Intangibles: Management, Measurement, and Reporting. The Brooking Institution Press, Washington D.C. Int. J. Account. 2001, 36, 501–503. [Google Scholar] [CrossRef]
- De Almeida Borges, P.; de Araújo, L.P.; Lima, L.A.; Ghesti, G.F.; Souza Carmo, T. The triple helix model and intellectual property: The case of the University of Brasilia. World Pat. Inf. 2020, 60, 101945. [Google Scholar] [CrossRef]
- De La Torre, R.; Alcaide-Muñoz, C.; Ollo-López, A. A review of intellectual property management practices using qualitative comparative analysis. Int. J. Intellect. Prop. Manag. 2019, 9, 264–286. [Google Scholar] [CrossRef]
- Graham, S.J.H.; Sichelman, T.S. Intellectual property and technology startups: What entrepreneurs tell us, 2016, Advances in the Study of Entrepreneurship. Innov. Econ. Growth 2016, 26, 163–199. [Google Scholar] [CrossRef]
- Choi, W.; Kwon, S.; Lobo, G. Market valuation of intangible assets. J. Bus. Res. 2000, 49, 35–45. [Google Scholar] [CrossRef]
- Godfrey, J.; Koh, P. The relevance to firm valuation of capitalising intangible assets in total and by category. Aust. Account. Rev. 2001, 11, 39–48. [Google Scholar] [CrossRef]
- Iñiguez, R.; López, G. Valoración de los activos intangibles en el mercado de capitales español. Rev. Española Financ. Contab. 2005, 34, 459–499. [Google Scholar]
- Ritter, A.; Wells, P. Identifiable intangible asset disclosures, stock prices and future earnings. Account. Financ. 2006, 46, 843–863. [Google Scholar] [CrossRef]
- Chalmers, K.; Clinch, G.; Godfrey, J. Adoption of international financial reporting standards: Impact on the value relevance of intangible assets. Aust. Account. Rev. 2008, 18, 237–247. [Google Scholar] [CrossRef]
- Dahmash, F.; Durand, R.; Watson, J. The value relevance and reliability of reported goodwill and identifiable intangible assets. Br. Account. Rev. 2009, 41, 120–137. [Google Scholar] [CrossRef]
- Oliveira, L.; Rodrigues, L.; Craig, R. Intangible assets and value relevance: Evidence from the Portuguese stock exchange. Br. Account. Rev. 2010, 42, 241–252. [Google Scholar] [CrossRef]
- Priotto, H.; Quadro, M.; Veteri, L.; Werbin, E. Los activos intangibles: Una prueba empírica en empresas argentinas. In Proceedings of the Trabajo presentado en el XVI Congreso Internacional de Contaduría, Administración e Informática, Coyoacán, Mexico, 5–7 October 2011. [Google Scholar]
- Ledoux, M.; Cormier, D. Market assessment of intangibles and voluntary disclosure about innovation: The incidence of IFRS. Rev. Account. Financ. 2013, 12, 286–304. [Google Scholar] [CrossRef]
- Ji, X.; Lu, W. The value relevance and reliability of intangible assets. Evidence fron Australia before and after adopting IFRS. Asian Rev. Account. 2014, 22, 182–216. [Google Scholar] [CrossRef]
- Kimouche, B.; Rouabhi, A. The impact of intangibles on the value relevance of accounting information: Evidence from French companies. Intang. Cap. 2016, 12, 506–529. [Google Scholar] [CrossRef]
- Da Silva, A.; Rodrigues, T.; Klann, R. A influência dos ativos intangíveis na relevância da informação contábil. Rev. Contemp. Contab. 2017, 14, 26–45. [Google Scholar] [CrossRef]
- Infante, R.; Ferrer, R. The impact of intangibles on the value relevance of accounting information: An empirical examination of listed companies in the Philippines from 2012 to 2016. In Proceedings of the Institute for Global Business Research Conference, Las Vegas, NV, USA, 12–13 October 2017. [Google Scholar]
- Ficco, C.; Werbin, E.; Díaz, M.; Prieto, B. Relevancia de los intangibles para la valoración externa de las empresas: Evidencias desde el contexto argentino. In Proceedings of the Trabajo Presentado en el XX Congreso Internacional AECA, Málaga, Spain, 25–27 September 2019. [Google Scholar]
- Pacheco, J.; Rover, S.; Rodrigues, E. Value relevance do nível de evidenciação do ativo intangível nas companhias de capital aberto brasileiras. Rev. Contemp. Contab. 2018, 15, 178–199. [Google Scholar] [CrossRef]
- Ficco, C.; Sader, G. Relevancia valorativa de los intangibles: Análisis pre-NIIF y NIIF en el mercado de capitales argentino. In Proceedings of the Trabajo Presentado en la XXX Conferencia Académica Permanente de Investigación Contable, Santa Marta, Colombia, 24 October 2019. [Google Scholar]
- Li, Y.; Song, Y.; Wang, J.; Li, C. Intellectual Capital, Knowledge Sharing, and Innovation Performance: Evidence from the Chinese Construction Industry. Sustainibility 2019, 11, 2713. [Google Scholar] [CrossRef]
- Swartz, G.; Swartz, N.; Firer, S. An empirical examination of the value relevance of intellectual capital using the Ohlson valuation model. Meditari Account. Res. 2006, 14, 67–81. [Google Scholar] [CrossRef]
- Wang, J. Investigating market value and intellectual capital for SyP 500. J. Intellect. Cap. 2008, 9, 546–563. [Google Scholar] [CrossRef]
- Yu, F.; Zhang, L. Does intellectual capital really create value? In Proceedings of the 4th International Conference on Wireless Communications, Networking and Mobile Computing, Dalian, China, 12–14 October 2008. [Google Scholar] [CrossRef]
- Whiting, R.; Miller, J. Voluntary disclosure of intellectual capital in New Zealand annual reports and the “hidden value”. J. Hum. Resour. Costing Account. 2008, 12, 26–50. [Google Scholar] [CrossRef]
- Liu, D.; Tseng, K.; Yen, S. The incremental impact of intellectual capital on value creation. J. Intellect. Cap. 2009, 10, 260–276. [Google Scholar] [CrossRef]
- Garcia, C.; Kimura, H.; De Barros, L.; Cruz, L. The impact of intellectual capital on value added for Brazilian companies traded at the BMF-BOVESPA. SSRN Electron. J. 2010. [Google Scholar] [CrossRef]
- Ferraro, O.; Veltri, S. The value relevance of intellectual capital on the firm’s market value: An empirical survey on the Italian listed firms. Int. J. Knowl. Based Dev. 2011, 2, 66–84. [Google Scholar] [CrossRef]
- Veltri, S.; Silvestri, A. Direct and indirect effects of human capital on firm value: Evidence from Italian companies. J. Hum. Resour. Costing Account. 2011, 15, 232–254. [Google Scholar] [CrossRef]
- Vafaei, A.; Taylor, D.; Ahmed, K. The value relevance of intellectual capital disclosures. J. Intellect. Cap. 2011, 12, 407–429. [Google Scholar] [CrossRef]
- Uyar, A.; Kılıc, M. Value relevance of voluntary disclosure: Evidence from Turkish firms. J. Intellect. Cap. 2012, 13, 363–376. [Google Scholar] [CrossRef]
- Ferchichi, J.; Paturel, R. The effect of intellectual capital disclosure on the value creation: An empirical study using Tunisian annual reports. Int. J. Account. Financ. Report. 2013, 3, 81–107. [Google Scholar] [CrossRef]
- Nimtrakoon, S. The relationship between intellectual capital, firms’ market value and financial performance: Empirical evidence from the ASEAN. J. Intellect. Cap. 2015, 16, 587–618. [Google Scholar] [CrossRef]
- Alfraih, M. The value relevance of intellectual capital disclosure: Empirical evidence from Kuwait. J. Financ. Regul. Compliance 2017, 25, 22–38. [Google Scholar] [CrossRef]
- Suherman, R. The impact of intellectual capital toward firm’s profitability and market value of retail companies listed in Indonesia Stock Exchange (IDX) from 2013–2016. Ibuss Manag. 2017, 5, 98–112. Available online: https://www.neliti.com/publications/183610/the-impact-of-intellectual-capital-toward-firms-profitability-and-market-value-o#cite (accessed on 20 March 2020).
- Sharma, P. Enterprise value and intellectual capital: Study of BSE 500 firms. Account. Financ. Res. 2018, 7, 123–133. [Google Scholar] [CrossRef]
- Smriti, N.; Das, N. The impact of intellectual capital on firm performance: A study of Indian firms listed in COSPI. J. Intellect. Cap. 2018, 19, 935–964. [Google Scholar] [CrossRef]
- Dumay, J. A critical reflection on the future of intellectual capital: From reporting to disclosure. J. Intellect. Cap. 2016, 17, 168–184. [Google Scholar] [CrossRef]
- Sader, G. La Revelación de Información Voluntaria Sobre Capital Intelectual y su Relevancia Valorativa en el Mercado de Capitales Argentino. Ph.D. Thesis, Universidad Nacional de Córdoba, Córdoba, Argentina, September 2019. [Google Scholar] [CrossRef]
- Criado-Aldeanueva, F.; Odishelidze, N.; Sanchez, J.M. On the possibility of quantitative definition of knowledge. Int. J. Gen. Syst. 2015, 44, 766–777. [Google Scholar] [CrossRef]
- Gonzalo Ramirez, P.; Hachiya, T. Intangible assets and market value of Japanese industries and firms. Int. J. Technol. Manag. 2012, 59. [Google Scholar] [CrossRef]
- García Gallo, M.; Jiménez Naharro, F.; Torres García, M. Utilización del conocimiento en el emprendimiento en el mercado español y andaluz. In Proceedings of the Primer Congreso Iberoamericano de Jóvenes Investigadores en Ciencias Económicas y Dirección de Empresas, Sevilla, Spain, 22–23 November 2018; Available online: http://www.ajicede.com/congreso-2/ii-congreso-ajicede/ (accessed on 13 March 2020).
- De Luca, M.M.M.; Parente, P.H.N.; Silva, E.M.S.; Sousa, R.R. The effect of creative corporate culture and intangibility on the performance of foreign firms traded on the NYSE. Innov. Manag. Rev. 2018, 15, 356–372. [Google Scholar] [CrossRef]
- Velibeyoglu, K.; Yigitcanlar, T. An evaluation methodology for the tangible and intangible assets of city-regions: The 6K1C framework. Int. J. Serv. Technol. Manag. 2010, 14, 343–359. [Google Scholar] [CrossRef]
- Fonseca, L.M.; Domingues, J.P. Exploratory research of ISO 14001:2015 transition among Portuguese organizations. Sustainability 2018, 10, 781. [Google Scholar] [CrossRef]
This article is governed by:
